A Structural Color Hydrogel for Diagnosis of Halitosis and Screening of PeriodontitisIssuing time:2026-04-28 10:22 Chuanshun Hu, Jieyu Zhou, Jin Zhang, Yonghang Zhao, Chunyu Xie, Wei Yin, Jing Xie, Huiying Li, Xin Xu, Lei Zhao, Meng Qin, Jianshu Lee Oral pathogens can produce volatile sulfur compounds (VSCs),which is the main reason for halitosis and indicates the risk ofperiodontitis. High-sensitivity detection of exhaled VSCs is urgentlydesired for promoting the point-of-care testing (POCT) of halitosisand screening of periodontitis. However, current detection methods often require bulky and costly instruments, as well as professional training, making them impractical for widespread detection.Here, a structural color hydrogel for naked-eye detection ofexhaled VSCs is presented. VSCs can reduce disulfide bonds withinthe network, leading to expansion of the hydrogel and thus changeof the structural color. A linear detection range of 0–1 ppm with adetection limit of 61 ppb can be achieved, covering the typical VSCconcentration in the breath of patients with periodontitis. Furthermore, visual and in situ monitoring of Porphyromonas gingivalisresponsible for periodontitis can be realized. By integrating thehydrogels into a sensor array, the oral health conditions of patientswith halitosis can be evaluated and distinguished, offering riskassessment of periodontitis. Combined with a smartphone capableof color analysis, POCT of VSCs can be achieved, providing anapproach for the monitoring of halitosis and screening ofperiodontitis. New concepts Currently, the staging and grading of periodontitis which are the basis ofeffective treatment closely rely on professional and complicated oralexaminations, lacking an efficient strategy for the screening of periodontitis. Oral pathogens responsible for periodontitis can produce volatilesulfur compounds (VSCs), which is the main reason for halitosis andindicates the risk of periodontitis, with the exhaled VSCs acting asbiomarkers for periodontitis. In this work, a structural color hydrogelfor naked-eye detection of oral pathogens, diagnosis of halitosis, andscreening of periodontitis is developed. A linear detection range of0–1 ppm VSCs with a detection limit of 61 ppb can be achieved, coveringthe typical VSC concentration in the breath of patients with periodontitis.On this basis, the visualized monitoring of Porphyromonas gingivalis andevaluation of the severity of halitosis are realized, offering risk assessment of periodontitis. Compared with the state-of-the-art detectionmethods, the structural color hydrogel has the potential foremployment in low-cost, high-sensitivity, and high-accuracy point-ofcare diagnosis of halitosis and screening of periodontitis without bulkyinstruments and power sources. This opens a door to auxiliary diagnosisof periodontitis and has great significance for stomatology. Introduction Periodontitis is a chronic inflammatory disease affecting theoral cavity, leading to the gradual degradation of periodontaltissues and compromising their integrity. Severe periodontitisranks sixth among the most prevalent diseases globally,impacting more than 10% of adults worldwide. It not onlyadversely affects patients’ oral health, but also can even induceother severe health problems. For example, pregnant womenare vulnerable to periodontitis, which significantly increasesthe risk of miscarriage and premature delivery. On the otherhand, periodontitis has brought a heavy financial burden toindividuals and the society. In 2018, periodontal diseaseresulted in economic losses of $150.57 billion and $197.09billion in the United States and European countries,respectively.5 Individuals in low-income countries and marginalized communities cannot afford related examinations andtreatments. Therefore, there is an urgent need to develop anaffordable, rapid, and convenient sensing method to achieve screening and monitoring of periodontitis, guiding the dailylife management and treatment in time. Indeed, periodontitis is mainly caused by oral pathogensincluding Porphyromonas gingivalis (P. gingivalis), Treponema denticola (T. denticola)andTannerella forsythia (T. forsythia). TheseGram-negative anaerobic bacteria are predominantly found inareas such as the tongue, interdental, and gingival pockets.They can induce periodontitis via stimulating the production ofinflammatory cytokines by host cells, promoting tissue cellapoptosis, and destroying periodontal connective tissues. For example, P. gingivalis can modulate bacterial virulenceand pathogenicity through mechanisms such as lysine acetylation, glycosylation, horizontal gene transfer and geneticrearrangements. Monitoring the growth and proliferation ofthese pathogens can provide information about the staging andgrading of periodontitis, which is the basis of effectivetreatment. During the metabolism process, periodontitis-related oralpathogens are able to produce volatile sulfur compounds(VSCs) such as hydrogen sulfide (H2S) and methanethiol(CH3SH), which are the major halitosis-forming gases. Theconcentration of VSCs in the breath of periodontitis patientstypically ranges from 0.1 ppm to 1 ppm. Especially, H2Scan contribute to as high as 95% of halitosis. As a symptomof periodontitis, the severity of halitosis is closely related to thepopulation of these oral pathogens. A larger population of thepathogens leads to severe halitosis and a higher risk ofperiodontitis. Hence, by monitoring the VSCs inexhaled breath, the detection of oral pathogens and screeningof periodontitis can be realized. Currently, the main methodsfor detecting VSCs include surface-enhanced Raman scattering,electrochemical analysis, gas chromatography, mass spectrometry, and sulfide ion-selective electrode techniques. Although these techniques offer high sensitivity, the instruments are bulky, costly, and require specialized training, making them impractical for widespread detection. VSC detectionhas also been accomplished through colorimetric sensing,commonly utilizing chromophores or fluorophores. However, these methods have certain limitations such as thetendency of dye molecules to undergo photobleaching underprolonged light exposure, the intricacy involved in synthesizingfluorescent probe molecules, and their susceptibility to fluorescence quenching. To promote the point-of-care testing(POCT) of VSCs, an easy-to-use and low-cost sensing methodwith high sensitivity is desired. In this work, a structural color hydrogel for naked-eyedetection of exhaled VSCs and screening of periodontitis ispresented (Fig. 1). We employ a disulfide-containing moleculeN,N0-bis(acryloyl)-(L)-cystine (BISS) as a VSC-responsive crosslinker within a polyacrylamide (PAAm) hydrogel network andintroduce the hydrogel into a photonic crystal structure. Thedisulfide bonds in the hydrogel can be reduced to sulfhydrylgroups by VSCs, leading to cleaved crosslinkers and thus adecreased crosslink density. As a result, the hydrogelswells, driving an increase in the lattice spacing of the photoniccrystal. According to Bragg’s law and Snell’s law, the location ofphotonic bandgap l can be calculated using the followingformula:
where D is the spacing between lattice planes, ni and fi are therefractive indices and the volume fractions of each component,respectively, y is the incident angle, and m is the diffractionorder. Thus, an increase in the lattice spacing leads to a redshift of the Bragg diffraction wavelength, causing a corresponding change in the structural color of the photonic crystal.The structural color hydrogel is capable of linear detection of0–1 ppm VSCs, which covers the typical concentration of VSCsexhaled by patients with periodontitis. A limit of detection(LOD) of 61 ppb to H2S can be achieved. Via real-time andin situ sensing of the VSCs produced by P. gingivalis, theproliferation process can be visually monitored, which showsconsistent results with the commonly used turbidimetricmethod. On this basis, the structural color hydrogel is appliedto detect exhaled VSCs of patients with halitosis, showingresults consistent with the clinical diagnosis. By integratinghydrogels of various colors into a sensor array, the oral healthconditions of patients with halitosis can be evaluated anddistinguished, offering risk assessment of periodontitis. Tofurther promote the POCT applications, a colorimetric analysisapplication (app) for smartphones is developed and combinedwith the hydrogel, to achieve high-accuracy detection of exhaledVSCs. This structural color hydrogel provides an approach forthe high-sensitivity, easy-to-use and low-cost monitoring ofhalitosis and oral pathogens, as well as screening ofperiodontitis.
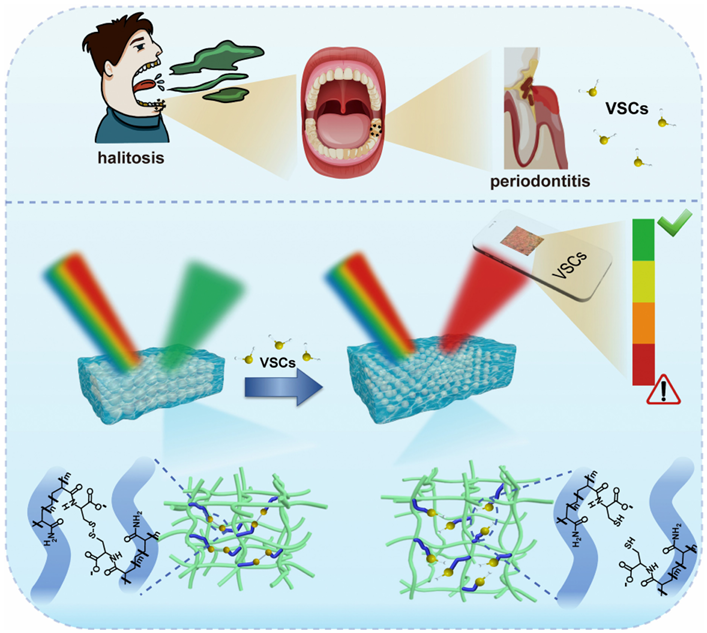
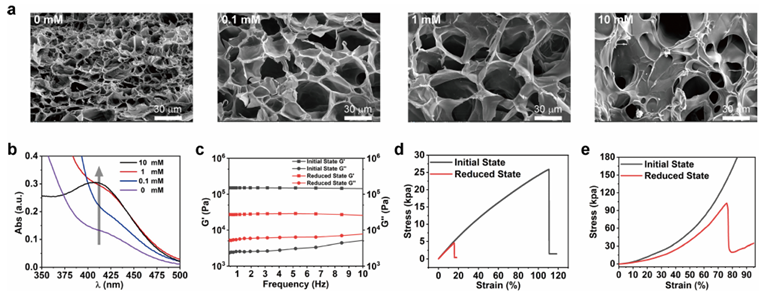
Fig. 1 Schematic illustration of the structural color hydrogel for diagnosis of halitosis and screening of periodontitis. Exhaled VSCs reduce the disulfidebonds to sulfhydryl groups within the hydrogel network, leading to expansion and color shift of the hydrogel. A higher concentration of VSCs suggestssevere halitosis and a higher risk of periodontitis. Results and discussion To enable the formation of a homogeneous and stable hydrogel network, a water-soluble molecule BISS is synthesized,which serves as the VSC-responsive crosslinker (Fig. S1, ESI?).The hydrogel is prepared by using acrylamide (AAm) as themonomer, BISS as the functional crosslinker, and N, N0methylenebisacrylamide (BIS) as the nonresponsive cross linker to support the network. The hydrogel is readily responsive toreducing substances. As shown in Fig. 2a, when exposed toincreasing concentrations of a sodium sulfide (Na2S) solution,the pore size of the network is significantly increased, suggesting remarkable swelling of the hydrogel. The porosity isincreased from ca. 31% to ca. 58% with an increase in the Na2S concentration from 0 to 10 mM (Fig. S2, ESI?). This is attributed to the reducing properties of H2S present in thesolution, which can reduce disulfide bonds to sulfhydryl groupsand thus break the functional crosslinker within the network,resulting in a decrease in the crosslink density. The redox responsiveness of the hydrogel is verified by detecting sulfhydryl groups in the network, using 5,50-dithiobis-(2-nitrobenzoicacid) (DTNB), which can react with thiols to produce 2-nitro-5thiobenzoic acid (NTB) (Fig. S3, ESI?).33 DTNB and NTB exhibit characteristic absorption around 325 nm and 412 nm, respectively. The hydrogel treated with Na2S is fully washed andthen incubated with DTNB solution. As demonstrated inFig. 2b, compared with the DTNB solution incubated with theas-prepared hydrogel (initial state), the solution incubated withthe Na2S treated hydrogel (reduced state) exhibits an increasein absorption at 412 nm, indicating the presence of sulfhydrylgroups in the reduced state network, which originate from theredox-responsive BISS crosslinker. As the concentration of Na2S solution increases, the absorption at 412 nm increases, revealing the increased sulfhydryl groups with increasing concentrations of the reducing substance. The alteration in the crosslink density of the hydrogel beforeand after reduction leads to variation in the mechanical properties. Fig. 2c demonstrates the rheological properties of theinitial state and reduced state hydrogels. The decreased storagemodulus (G0) and increased loss modulus (G00) reveal a decreasein the crosslink density of the hydrogel after reduction. Thereduced state hydrogel exhibits a decline in mechanical properties to both tensile and compressive stress. The tensile strengthdecreases from 25.9 kPa to 4.6 kPa, and the stretchabilitydeclines from 110% to 16% after reduction (Fig. 2d). The initialstate hydrogel maintains its integrity and bears a compressivestress of 180 kPa when the strain reaches 80%, while thereduced state is ruptured at a strain of 75% (Fig. 2e). Thisdecline in mechanical properties corresponds to a reduction inthe crosslink density of the hydrogel network.
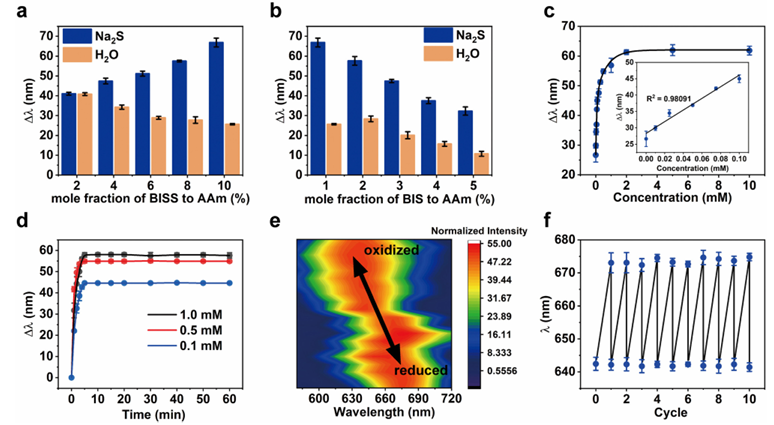
Fig. 2 Morphological and mechanical changes of the hydrogel responding to the Na2S solution. (a) Scanning electron microscopy (SEM) images of thehydrogel network after incubating with increasing concentrations of Na2S solutions. (b) UV absorption spectra of DTNB solutions after incubating withNa2S treated hydrogels. Absorption at 412 nm increases with increasing concentrations of the Na2S solution. (c)–(e) Rheological properties (c), tensilestress–strain curves (d), and compressive stress–strain curves (e) of the initial state and reduced state hydrogels. Based on the redox responsiveness of the hydrogel, weintroduce the network into a photonic crystal structure toconstruct a structural color hydrogel. The photonic crystalstructure is characterized by a long-range ordered assembly oflatex particles, and the light diffracted by the face-centeredcubic (fcc) (111) plane gives the vivid structural color (Fig. S4,ESI?). Energy dispersive spectroscopy (EDS) indicates the existence of sulfur element and the uniform distribution of the hydrogel in the photonic crystal structure. Upon reducingsubstrates such as Na2S, the photonic crystal structure displaysa significant increase in the lattice spacing of the (111) plane,which is driven by swelling of the embedded hydrogel (Fig. S5,ESI?). The performance of the structural color hydrogel isaffected by the concentration of both BISS and BIS crosslinkers(Fig. S6, ESI?). As shown in Fig. 3a, when the mole fraction ofBISS relative to AAm is increased from 2% to 10% (with aconstant mole fraction of 1% BIS relative to AAm), the responsiveness of the structural color hydrogel to the Na2S solution isimproved, presenting diffraction shift from ca. 40 nm to ca.65 nm. In order to analyze the diffraction shift caused only by reduction, we measure the responsiveness to pure water in themeantime. An increased BISS crosslinker leads to restrictedswelling, showing a diffraction shift from ca. 40 nm to ca.25 nm. More BISS indicates more disulfide bonds in the network, which can be cleaved by reducing substances to drive theswelling of the hydrogel. This effect overwhelms the restrictedswelling caused by an increase in the crosslink density, leadingto expansion of the hydrogel and red shift of the photonicPublished on 10 November 2023. Downloaded by Sichuan University on 11/21/2023 12:50:57 AM. bandgap when responding to Na2S. Thus, the structural colorhydrogel displays improved redox responsiveness with anincrease in the BISS content. In contrast, increased BIS (witha constant mole fraction of 10% BISS relative to AAm) results ina denser network without any responsive groups, whichdecreases the redox responsiveness (Fig. 3b). In order to achieveremarkable responsiveness, we choose 10% BISS and 1% BIS toconstruct the structural color hydrogel.
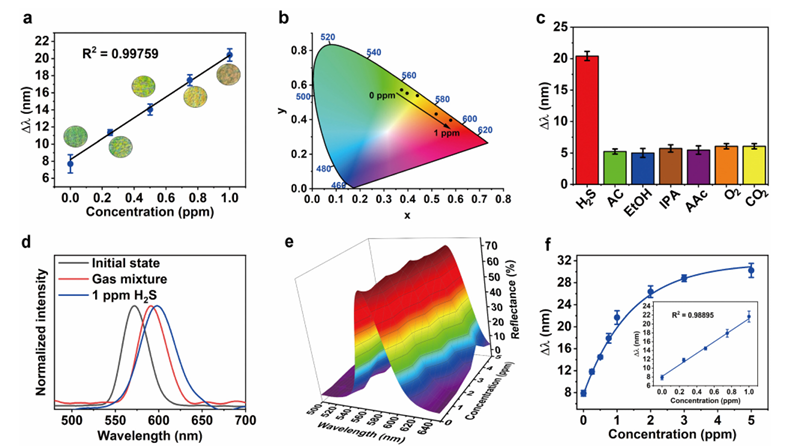
Fig. 3 Redox responsiveness of the structural color hydrogel. (a) and (b) Relationship between diffraction shift and the molar fraction of BISS (a) and BIS(b). (c) Relationship between diffraction shift and the Na2S solution concentration. The linear detection range is 0–0.1 mM. (d) Time-dependentdiffraction shift to Na2S solutions of various concentrations. The equilibrium is reached in approximately 5 minutes. (e) and (f) Reversible diffractionwavelength change between the oxidized and reduced states (e) and in ten cycles of oxidation and reduction (f). he location of the photonic bandgap depends on theconcentration of the reducing substrate (Fig. S7, ESI?). Asshown in Fig. 3c, an increase in the concentration of Na2Ssolution leads to more red-shifted diffraction. When theconcentration of the Na2S solution reaches 2 mM, the bandgapshift is 62 nm and it remains with a further increase in Na2S,indicating the saturation state of the hydrogel. The lineardetection range for the Na2S solution is 0–0.1 mM, with anLOD of 0.01 mM (LOD = 3s/S, where s is the standard error ofthe intercept and S is the slope of the linear regression equation Communicationy = 177.87278x + 28.32498 (R2 = 0.98091)). Due to the high affinity to reducing substrates and the hydrophilicity of thehydrogel, rapid detection can be achieved. The equilibrium isreached in approximately 5 minutes, despite the different concentrations of the Na2S solution (Fig. 3d and Fig. S8, ESI?).The reduced hydrogel can be oxidized again, showing a photonic bandgap switched between 675 nm (reduced state) and642 nm (oxidized state) (Fig. 3e). The reversibility can berepeated, showing an unchanged photonic bandgap in tencycles of reduction and oxidization (Fig. 3f). The coefficients of the reflection wavelength in the oxidized and reduced statesover ten cycles are 0.00052 and 0.00130, respectively, indicating that the structural color hydrogel has good cycling stability. Exhaled VSCs are the reason for halitosis and a marker of periodontitis. Since the main component of VSCs is H2S, wetarget H2S to assess the VSC responsiveness of the structural color hydrogel. Fig. 4a demonstrates the linear detection of H2Sby the structural color hydrogel. When exposed to H2S rangingfrom 0 to 1 ppm (the typical concentration range ofVSCs exhaled by patients with periodontitis), the hydrogelexhibits diffraction wavelengths shifting from 577 nm to592 nm (Fig. S9, ESI?). An LOD of 61 ppb can be achieved.Although the wavelength change is not very remarkable, thecolor changes are obvious enough. The hydrogel in the initial state is greenish and can gain a reddish hue once it is reducedby H2S, enabling high-precision visual sensing. By taking digital photos of the structural color hydrogels at differentH2S response times and calculating the DRGB values
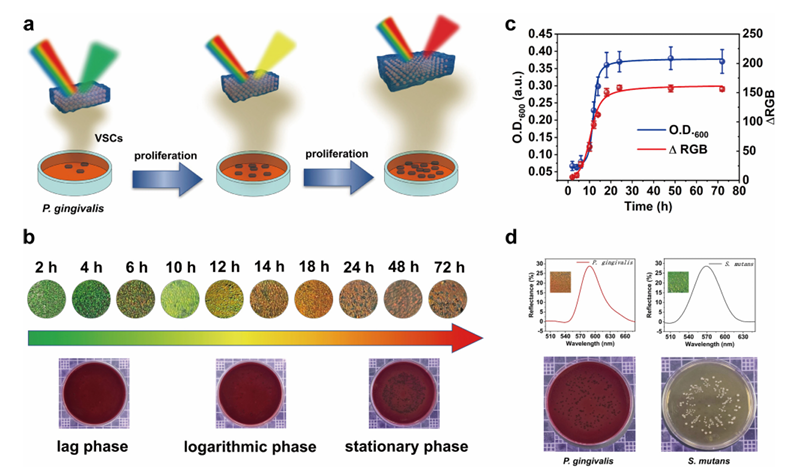
Fig. 4 Response of the structural color hydrogels to VSCs. (a) Linear detection of 0–1 ppm H2S. The structural color changes from green to red withincreasing concentrations of H2S. (b) Corresponding plots of the CIE data. (c) Diffraction shift of the structural color hydrogel responding to various gases,each at a concentration of 1 ppm. (d) Response of the structural color hydrogel to a gas mixture containing interfering gases and 1 ppm H2S. (e) and(f) Reflectance spectra (e) and diffraction shift (f) of the structural color hydrogel responding to H2S mixed with human exhaled gas. With an increase inthe H2S concentration from 0 to 5 ppm, the photonic bandgap red shifts. The linear detection range is 0–1 ppm. To evaluate its performance for practical applications, the responsiveness of the structural color hydrogel to interfering gases is investigated, since human exhaled gas also contains compounds such as alcohols, aldehydes, acids, oxygen, carbon Materials Horizonsdioxide, etc. Fig. 4c and Fig. S13 (ESI?) demonstrate asignificant difference in the responsiveness to H2S and othergases (acetone (AC), ethanol (EtOH), isopropyl alcohol (IPA),acetic acid (AAc), O2 and CO2, all at a concentration of 1 ppm), as the bandgap shifts are negligible for the interfering gases.The structural color hydrogel is then exposed to a gas mixturecontaining 1 ppm H2S and interfering gases (the types andconcentrations of interfering gases are the same as in Fig. 4c).As shown in Fig. 4d, the bandgap shifts of the hydrogel responding to the gas mixture and H2S are similar, indicatingthe capability of anti-interference detection of H2S. Furthermore, H2S is detected in a complex environment of humanexhaled gas. Fig. 4e shows the location of photonic bandgapshifts from 577 nm to 601 nm, with an increase in theconcentration of H2S from 0 to 5 ppm in human exhaled gas. Linear detection can be also achieved for 0–1 ppm H2S (Fig. 4f), demonstrating the same performance as for pure H2S gas.These results indicate that the structural color hydrogel exhibits stable detection in a complex gas environment, suggesting its application for human exhaled samples. Oral pathogens responsible for periodontitis, e.g., P. gingivalis, produce VSCs during their metabolism. Therefore, thestructural color hydrogel can be used to realize visual and in situ monitoring of the pathogen proliferation, during whichthe concentration of VSCs is increased (Fig. 5a). As shown inFig. 5b, the structural color hydrogel placed above the culture dish shows changing colors as P. gingivalis grows. During thefirst ten hours, P. gingivalis shows slow multiplication and a lowbacterial population, suggesting a lag phase of its growth. Atthis stage, the structural color hydrogel remains green andturns to yellow-green at 10 h. From 12 h to 18 h, P. gingivalis grows and proliferates rapidly, corresponding to the logarithmic phase. The hydrogel exhibits a remarkable color change toorange. During the subsequent 24 h to 72 h, the growth of P.gingivalis reaches the stationary phase, due to a decrease innutrients in the medium, accumulation of toxic metabolites,and other factors that resulted in a decline in bacterial reproduction. Bacterial death also occurs, creating a balancebetween bacterial proliferation and death. As a result, the totalbacterial population remains constant, and the hydrogel showsan almost unchanged red color. The color changes are thenconverted to DRGB values and compared with the O.D.600 valuesof P. gingivalis at different incubation times (Fig. 5c). Bacterialgrowth curves plotted using these two methods show the sametrend, suggesting the reliability of monitoring P. gingivalis bythe structural color hydrogel. To evaluate its specificity topathogens causing periodontitis, the structural color hydrogelis also applied to another oral pathogen, Streptococcus mutans(S. mutans), which is responsible for dental caries (Fig. 5d).While the hydrogel for P. gingivalis exhibits a significant changein diffraction shift and structural color, the hydrogel cannotrespond to S. mutans, retaining its photonic bandgap at 570 nmand green color. Thus, the structural color hydrogel is capableof selective detection of periodontitis related pathogens, suggesting its application for the screening and monitoring of periodontitis.
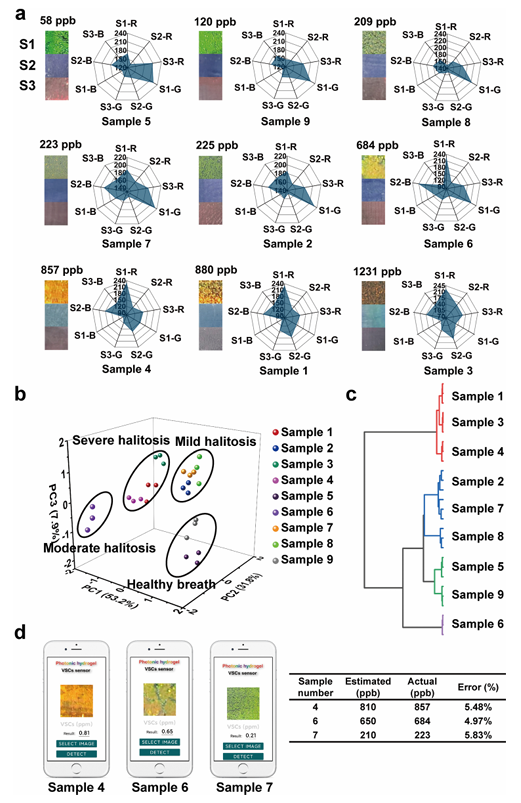
Fig. 5 Monitoring of P. gingivalis by the structural color hydrogel. (a) Schematic diagram illustrating the proliferation of P. gingivalis and the colorresponse of the hydrogel. (b) Incubation time dependent colors of the hydrogel. The color changes from green to red with an increased population ofP. gingivalis. (c) O.D.600 values of bacterial suspensions and DRGB of the structural color hydrogel as a function of incubation time. The two curves showthe same trend. (d) Reflectance spectra and structural color images of the structural color hydrogel responding to P. gingivalis and S. mutans. Based on the capability of detecting VSCs and oral pathogens responsible for periodontitis, the structural color hydrogelis applied to practical breath samples to evaluate oral health conditions of patients with halitosis, which can provide information about the risk of periodontitis. A single structural colorhydrogel is first employed for clinical samples, and it shows distinct diffraction shifts and colors for the five samples containing different concentrations of VSCs (Fig. S14, ESI,? the VSC concentration is provided by the clinically used Halimeter measurements). The quantitative detection result based onthe curve in Fig. 4f is consistent with the clinical diagnosis(Table S1, ESI?). To gain more sensing information and improve the sensitivity, a sensor array composed of hydrogels of various colors is designed. As shown in Fig. 6a, the sensorarray shows distinct color patterns for nine clinical samples containing VSCs ranging from 58 ppb to 1231 ppb. With anincrease in the concentration of VSCs, the color of S1 turnsfrom green to dark green, yellow-green, orange, and red successively; S2 changes from purple to blue; and the red color of S3becomes darker. The color patterns are then converted to RGBvalue-based response patterns (Fig. 6a and Table S2, ESI?). Each clinical sample possesses its specific pattern, suggesting distinguished sensing of the exhaled breath. Fig. 6b presents the results of principal component analysis (PCA) of the obtaineddata (9 samples 3 RGB values 3 sensors 3 trials). PC1,PC2, and PC3are the first three principal components obtained from the analysis, which capture the variables with significant variance. The data clusters corresponding to the clinical samples can be clearly divided into four groups: healthy breath (sample 5 (58 ppb) and sample 9 (120 ppb)), mild halitosis (sample 2 (225 ppb), sample 7 (223 ppb) and sample 8 (209 ppb)), moderate halitosis (sample 6 (684 ppb)), and severehalitosis (sample 1 (880 ppb), sample 3 (1231 ppb) and sample4 (857 ppb)). This classification is consistent with that of theHalimeter measurements. The cumulative contribution of thethree principal components accounts for 92.85% of the variance (Table S3, ESI?), indicating the successful discrimination of the severity of halitosis. The result of the hierarchical cluster analysis (HCA) is demonstrated in Fig. 6c. The spatially distributed distances between the clusters reflect the variations and similarities in the severity of halitosis among the nine clinical samples, which is consistent with the result shown inFig. 6b. The severity of halitosis is closely associated with periodontitis; severe halitosis suggests a higher risk of periodontitis. Thus, this sensor array can be used for the screening of periodontitis, without complicated and professional oral examination.
Fig. 6 Application of the structural color hydrogel to clinical breath samples of patients with halitosis. (a) Color patterns and the corresponding RGBvalue patterns of the sensor array to nine clinical breath samples. (b) Graphs of PCA demonstrating clear clustering of different levels of halitosis.(c) Dendrogram of HCA showing similarity of the samples. (d) Detection of exhaled VSCs via a smartphone. The screenshots show estimatedconcentrations for samples with actual concentrations of 857 ppb, 684 ppb and 223 ppb, respectively. The error is defined as the ratio of the differencevalue to the actual value. To facilitate POCT of the exhaled VSCs, a smartphone app is developed for colorimetric analysis and combined with the structural color hydrogel (Fig. S15, ESI?). The app offers an automated test result by photographing and analyzing a sampleof unknown concentration. Three clinical samples corresponding to mild, moderate, and severe halitosis, respectively,are chosen to evaluate the accuracy of the sensing system. Asshown in Fig. 6d, the concentrations of VSCs estimated by theapp are 810 ppb (sample 4), 650 ppb (sample 6), and 210 ppb(sample 7), yielding calculated errors (i.e., the ratio of difference value to actual value) of 5.48%, 4.97%, and 5.83%, respectively.The detection results of other samples are presented in Fig. S16(ESI?). The smartphone-based analysis offers an approach to monitoring halitosis and screening of periodontitis with highaccuracy. Conclusions In summary, we develop a user-friendly and low-cost structural color hydrogel to achieve high-sensitivity detection of exhaled VSCs, thus realizing the monitoring of oral pathogen responsible for periodontitis, diagnosis of halitosis, and screening of periodontitis. A disulfide-containing molecule is employed as a functional crosslinker into the hydrogel network that is embedded in aphotonic crystal structure. The exhaled VSCs are able to reduce the disulfide bonds to sulfhydryl groups, leading to the rupture of the crosslinker and expansion of the hydrogel. As a result, the photonic bandgap shifts and the structural color changes. Linear detection of 0–1 ppm VSCs with a detection limit of 61 ppb is achieved, which covers the typical concentration of VSCs exhaled by patients with periodontitis. Visual and in situ monitoring of P. gingivalis is realized, whose proliferation indicated by the structural color hydrogel is consistent with that of the commonly used turbidimetric method, suggesting the application for periodontitis monitoring. The structural color hydrogel is further applied to clinical breath samples to evaluate the oral health conditions of patients with halitosis. The array-based sensing performs discrimination of the severity of halitosis, providing a risk assessment of periodontitis. To facilitate the POCT application, a smartphone capable of colorimetric analysis is combined with the hydrogel, exhibiting high-accuracy detection of exhaled VSCs. This structural color hydrogel provides a convenient approach to the auxiliary diagnosis of periodontitis, which will reduce the burdens of complicated oral examination and guide people’soral care. Experimental Materials Poly (styrene–methyl methacrylate–acrylic acid) [P(St–MMA–AA)]nanoparticles were prepared by a mature method. The particle size was controlled at 210–300 nm. P gingivalis was from the State Key Laboratory of Oral Diseases of West China School/Hospital of Stomatology Sichuan University. Acrylamide (AAm), N, N0-methylenebisacrylamide (BIS), 2-hydroxy-2-methylpropiophenone (Darocur 1173), hemin, calcium chloride (CaCl2), sodium hypochlorite (NaClO) standard solution, and 3-(trimethoxysilyl) propyl methacrylate (TMSPMA) were purchased from Macklin (Shanghai, China). Acryloyl chloride and vitamin K were purchased from J&K Scientific (Beijing, China). L-Cystinewas purchased from Solarbio (Beijing, China). Sodium sulfide (Na2S9H2O), ferrous sulfide (FeS) and sodium hydrosulfide(NaHS) were purchased from Aladdin (Shanghai, China). Goatblood was purchased from Yuduobio (Shanghai, China). Abrain–heart infusion broth was purchased from OXOID (Basingstoke, England). Agar was purchased from neoFroxx (Einhausen, Germany). Phosphate buffered saline was purchased from Biosharp (Hefei, China). Methanol and sodiumhydroxide were purchased from Jinshan Chemical Test (Chengdu, China). Ether and hydrochloric acid were purchasedfrom Chron Chemicals (Chengdu, China). Synthesis of N,N'-bis(acryloyl)-(L)-cystine (BISS) N,N'-Bis(acryloyl)-(L)-cystine was synthesized by referringto a method from the literature. Sodium hydroxide (2 g,50 mmol) and L-cystine (2.70 g, 11.2 mmol) were dissolved in methanol (70 mL) with stirring and transferred to a cold trap at ℃. Acryloyl chloride (2.20 mL, 27.2 mmol) was added dropwise at 0℃. The reaction mixture was then transferred to room temperature and stirred for 12 hours. After the reaction, the insoluble by-products were removed by filtration, and the filtrate was added dropwise to cold ether with rapid stirring.The resulting suspension was separated by filtration, and the solid product was washed thoroughly with ether. The solid was then vacuum dried at 35 ℃ to obtain N,N'-bis(acryloyl)-(L)cystine. The compound was characterized using a 1H NMRspectrum recorded on an AV III HD 400 MHz NMR spectrometer (Bruker). 1H NMR (400 MHz, D2O), d = 6.50–6.10 (m, 2H, CH2QCHCONH–), 5.90–5.70(t, 1H, CH2QCH–CONH–), 4.70–4.50 (m, 1H,–CH–). 3.40–3.00 (m, 2H,–CH2–). Preparation of the VSC-responsive structural color hydrogel Homogeneous photonic crystal templates were prepared through vertical deposition. Clean slides were inserted into a 0.1 wt% suspension of P(St–MMA–AA) nanoparticles. Covalent connections between the slides and the hydrogels were formedusing 3-(trimethoxysilyl)propyl methacrylate-treated slides.These slides were placed above the prepared photonic crystal templates, leaving a 150 mm gap between them. Next, a specific percentage of AAm, BIS, and BISS was dissolved in ultra purewater, followed by the addition of the photo initiator Darocur1173 (1 wt% solution). Subsequently, the hydrogel precursor solution was capillary-filled into the space between the two slides. Polymerization was conducted under UV irradiationusing a 365 nm, 200 W light source for 5 minutes. The two glass slides were carefully separated. The prepared structural color hydrogels were sealed and stored at a low temperature. Redox responsiveness Na2S9H2O crystals were dissolved in ultrapure water to preparea 10 mM solution. The pH of the solution was adjusted to 7.4 using hydrochloric acid. Subsequently, the structural color hydrogel was immersed in the solution. After 30 minutes, the hydrogel was removed, and the reflectance spectra were acquired using a fiber spectrometer. The diffraction shift/bandgap shift was obtained by subtracting the diffraction wavelength of the structural color hydrogel obtained after the response from that before the response. To obtain accurate results, it is crucial to control the vertical angle of the lightsource and prevent interference from external light during the detection process. We evaluated the responsiveness of the reducing substances using various monomer ratios of the structural color hydrogel (Fig. 3a and b). Ultimately, a ratio of 10% BISS and 1% BIS was selected for subsequent experiments. Unless otherwise specified, this formulation was used to prepare hydrogels for subsequent characterization and experiments. While investigating the relationship between the bandgap shifts of the structural color hydrogels and the concentration and response time of the Na2S solution, all assay conditions remained constant, except for the concentration and response time of the Na2S solution. The porosity of the hydrogel was obtained by selecting the pore region of the SEM image of the hydrogel network and calculating the ratio of thea rea of the pore region to the area of the whole image using ImageJ (Fiji) software. Reversibility The prepared structural color hydrogel was placed in 1 mMNa2S solution of pH = 7.4, fully reduced and then removed and washed with ultrapure water to remove the residual solution. Subsequently, the hydrogel was placed in 1 mM pH = 7.4 NaClOsolution, fully oxidized and then removed and washed withultrapure water to remove the residual solution. Subsequently, the structural color hydrogel was placed in Na2S solution againand ten cycles were repeated, and the reflection spectra of the oxidized and reduced states were recorded under each cycle. Binding energy calculations The structures of the BISS repeating unit, H2S and their complexes (BISS repeating unit with H2S) were first optimized by using the DFT at the B3LYP/6-311G* level. All geometry optimizations including the implicit solvent effect with SMD were performed using the Gaussian 09 package. The harmonic frequency calculations were carried out at the same level of theory to help verify that all structures have no imaginary frequency. Then the single-point energies of complexes were obtained at the B3LYP/def2-TZVP level after the previous optimization, which is considered the basis set superposition error(BSSE). The dispersion correction DFT-D3 method was also employed in all calculations. The binding energy of the interaction patterns of the molecules (Ebind) was calculated using the following equation: Ebind = EAB–(EA + EB)+EBSSE where EA and EB respectively represent the energies of A (H2S) and B (BISS repeating unit), EBSSE is the BSSE corrected energy of interaction patterns and EAB is the total energy of interaction patterns; a negative value of Ebind indicates that the process is an exothermic reaction and a high negative value corresponds to a stronger interaction, which indicates more heat release and a more stable product. Reaction energy barrier calculation All the geometric optimizations and frequency calculations involving pre-reactive compounds (RC), transition states (TS), and post-reactive compounds (PC) were performed using B3LYP with the 6-311G* basis set. Vibrational frequencies were calculated to ensure that all of the stationary points are local minima or transition structures. All geometry optimizations including the implicit solvent effect with SMD were performed using the Gaussian 09 package. Furthermore, intrinsic reaction coordinate (IRC) calculations have been executed at the same level to determine whether the located transition states connect with the desired pre-reactive compounds and post-reactive compounds. To obtain more reliable energetics, single-pointenergy calculations for the stationary points were carried outbased on the B3LYP/6-311G* optimized geometries usingB3LYP/ma-def2-TZVP. VSC responsiveness H2S is produced through the reaction of FeS with dilutehydrochloric acid. The generated H2S is purified using a saturated NaHS solution and anhydrous CaCl2. It is then fedinto a 15 L aluminum foil collection bag at a flow rate regulatedby a flowmeter. The valve is closed to stop the collection after a while. The volume of hydrogen sulfide introduced is determined based on the flow rate and duration of infusion. Next, the bag is filled with high-purity nitrogen to achieve a specific concentration of H2S. An additional 15 L foil bag is filled with high-purity nitrogen. The bag with the confirmed hydrogensulfide concentration and the nitrogen-filled bag are linked to aperistaltic pump and flowmeter, creating two gas delivery pathsthat connect to the same wide-mouthed bottle. The preparedstructural color hydrogel sensor (to observe the structural colorchange with a hydrogel formulation of 10% BISS and 5%BIS forgas detection, unless otherwise specified) is positioned insid ethe wide-mouthed bottle. The peristaltic pump is activated, and the flow rate of the two gases is adjusted based on the H2S concentration. The CIE chromaticity values were obtained by mathematically processing the reflectance spectrum data through origin software according to existing methods. Kinetic characterization of H2S diffusion in hydrogels The concentration of H2S introduced into the device is controlled in the same way as in the experimental part of the VSC responsiveness. Digital photos of the structural color hydrogel can be captured by placing a smartphone with a turn-on flashlight on top of the box and ensuring that the light passes through the opening. In this case, the incident light is vertical to the plane of the structural color hydrogel to eliminate the effect of the angle of incidence on the color (the digital photos in this article were obtained by the above method). Digital photos of the structural color hydrogel were taken every two minutes while the gas was being introduced. The RGB values of the photos were extracted using ImageJ (Fiji) and the DRGB values relative to the initial state were calculated to create akinetic curve of the DRGB values versus the response time. Monitoring of the growth and proliferation of P. gingivalis The culture medium for P. gingivalis was prepared by combining 10 mL of the brain–heart infusion broth medium, 10 mLof 1% vitamin K in 95% ethanol solution, and 100 mLof a0.05% Hemin solution (containing 1% 1 M NaOH). P. gingivalis was inoculated in the sterilized medium, and the structural color hydrogel was securely attached to the culture dishlid, ensuring no contact between the hydrogel and the medium. The structural color hydrogel was co-cultured with the P gingivalis suspension in an anaerobic incubator. Atspecific intervals, the structural color hydrogel was removed from the ultra-clean bench and the digital photos were taken with a smartphone. The bacterial suspension from the culture dish was then transferred to a 96-well plate to measure the bacterial growth by obtaining the O.D.600 values using a SpectraMax enzyme calibration. Additionally, the bacterial solutionwas diluted 106 times and applied to an agar plate containinggoat blood, which was subsequently placed in the anaerobic incubator. Subsequently, another piece of structural colorhydrogel was affixed to the lid of the culture dish and subjected to co-cultivation with the bacterial suspension in the anaerobic incubator for a designated duration. The optical images of the structural color hydrogels at various incubation times were analyzed using ImageJ (Fiji) software to measure the RGB values. Array-based detection of clinical breath samples Exhaled breath samples from volunteers were collected from the West China School/Hospital of Stomatology Sichuan University and stored in a 1 L bag. Photonic crystal templates were fabricated by depositing P(St–MMA–AA) nanoparticles with varying particle sizes, following the procedure outlined in the preceding section. Subsequently, structural color hydrogels exhibiting three distinct initial colors were synthesized utilizing these templates. The collected samples were then introduced into a wide-mouthed bottle containing the three sensing units using a peristaltic pump. After a 30 minutes response period, the peristaltic pump was deactivated, and the sensor array was extracted for further analysis. Optical images of the sensor array were captured using a mobile phone camera. The RGB values of each sensing unit were extracted utilizing the ImageJ (Fiji) software. These RGB values were subsequently subjected to principal component analysis (PCA) using SPSS27 software to obtain the principal component scores. Furthermore, a hierarchical cluster analysis diagram was generated employing the cluster analysis algorithm in the origin software. APP program development The program development principle involves training a given dataset using a pre-trained model for fine-tuning the neural network. The dataset was augmented using various data enhancement techniques, including bilinear interpolation forimage resizing, image center rotation, image brightness adjustment, and image Gaussian blur. This realizes the assessment ofVSC concentration by analyzing the color of the photograph.The application was designed and developed using Android Studio, utilizing JDK version 1.8 and Python version 3.8. Themodel was trained using the Pytorch framework. Characterization The scanning electron microscopy (SEM) and energy dispersive spectroscopy (EDS) images of hydrogels were acquired using an Apreo S HiVoc microscope (ThermoFisherScientific). The UV absorption spectrum was obtained by testing with a TU-1901UV-Vis spectro photometer (PERSEE). The rheological properties of the hydrogels were tested using an MCR302 rheometer (Anton Paar). The tensile and compressive properties of the hydrogel were obtained from a TA.XTC-20 texture instrument (BosinTech). The reflectance spectra were obtained using a fiber spectrometer (FX2000). Author contributions Chuanshun Hu and Meng Qin conceived the concept. Jianshu Li supervised the project. Chuanshun Hu and Meng Qin designed the experiment. Chuanshun Hu conducted the experiments. Jin Zhang and Xin Xu provided Porphyromonas gingivalisand an experimental platform for monitoring oral pathogens. Jieyu Zhou, Wei Yin and Lei Zhao provided breath samples from clinical patients. Yonghang Zhao and Huiying Li designed and developed the APP. Chunyu Xie provided the computing platform for molecular modelling. Chuanshun Hu and MengQin wrote the manuscript. Chuanshun Hu and Meng Qindiscussed the results and commented on the manuscript at all stages. All authors contributed to the analysis and discussion of the data. Conflicts of interest The authors declare that they have no known competing financial interests or personal relationships that could haveappeared to influence the work reported in this paper. Acknowledgements We acknowledge the financial support from National Natural Science Foundation of China (Grant No. 52103176, U22A20158, and 52073191) and Sichuan Science and Technology Program (2022NSFSC1934 and 2022NSFSC1949). We thank the Analytical & Testing Centre of Sichuan University for providing thematerial testing equipment. We thank the State Key Laboratory of Oral Diseases West China Hospital of Stomatology Sichuan University for providing P. gingivalis and an experimental platform. The drawing material in Fig. 1 was provided by Figdraw. Source: rsc.li/materials-horizons |